
RNAscape is a tool for the geometric mapping and customizable visualization of RNA structure.
Documentation
Quickstart
To get started, click Run on Example Data in the website header. This runs RNAscape on PDB structure 3zp8 using your selected settings.
You can also enter a PDB ID and click Run to run RNAscape on the selected PDB ID.
Lastly, you can click Example Input here to download an example input data file.
Uploading Data
RNAscape supports mmCIF or PDB format file uploads. The max file size is 50 MB.
Files greater than 7 MB will be processed asynchronously. Please note the unique link that is displayed. The structure will be available for between 24 and 48 hours.

To load a file for processing, click Browse or drag the file into the browse input box. This may appear differently depending on your operating system and web browser.
Click Run to generate the 2D visualization for a loaded file or PDB ID.
Modifying Mapping
After a structure is visualized, click the Modify Mapping button to enter an interactive mode, where you can move nodes on the graph.
Simply click and drag on a node to move it. After you are satisfied with your changes, click Regenerate Plot to generate a new image with the updated coordinates. Any Visual Settings changes, including rotation, will be applied along with the updated positions.
Click Modify Mapping to exit the view (without saving changes) and return to the output image.
Use the Zoom In, Zoom Out, and Center & Reset Zoom buttons to adjust the interactive graph accordingly. You can also scroll to zoom, and click and drag the white space to pan.
Hover over a node to see its name, position, and chain.
Please note this view is only available for structures under 7 MB.
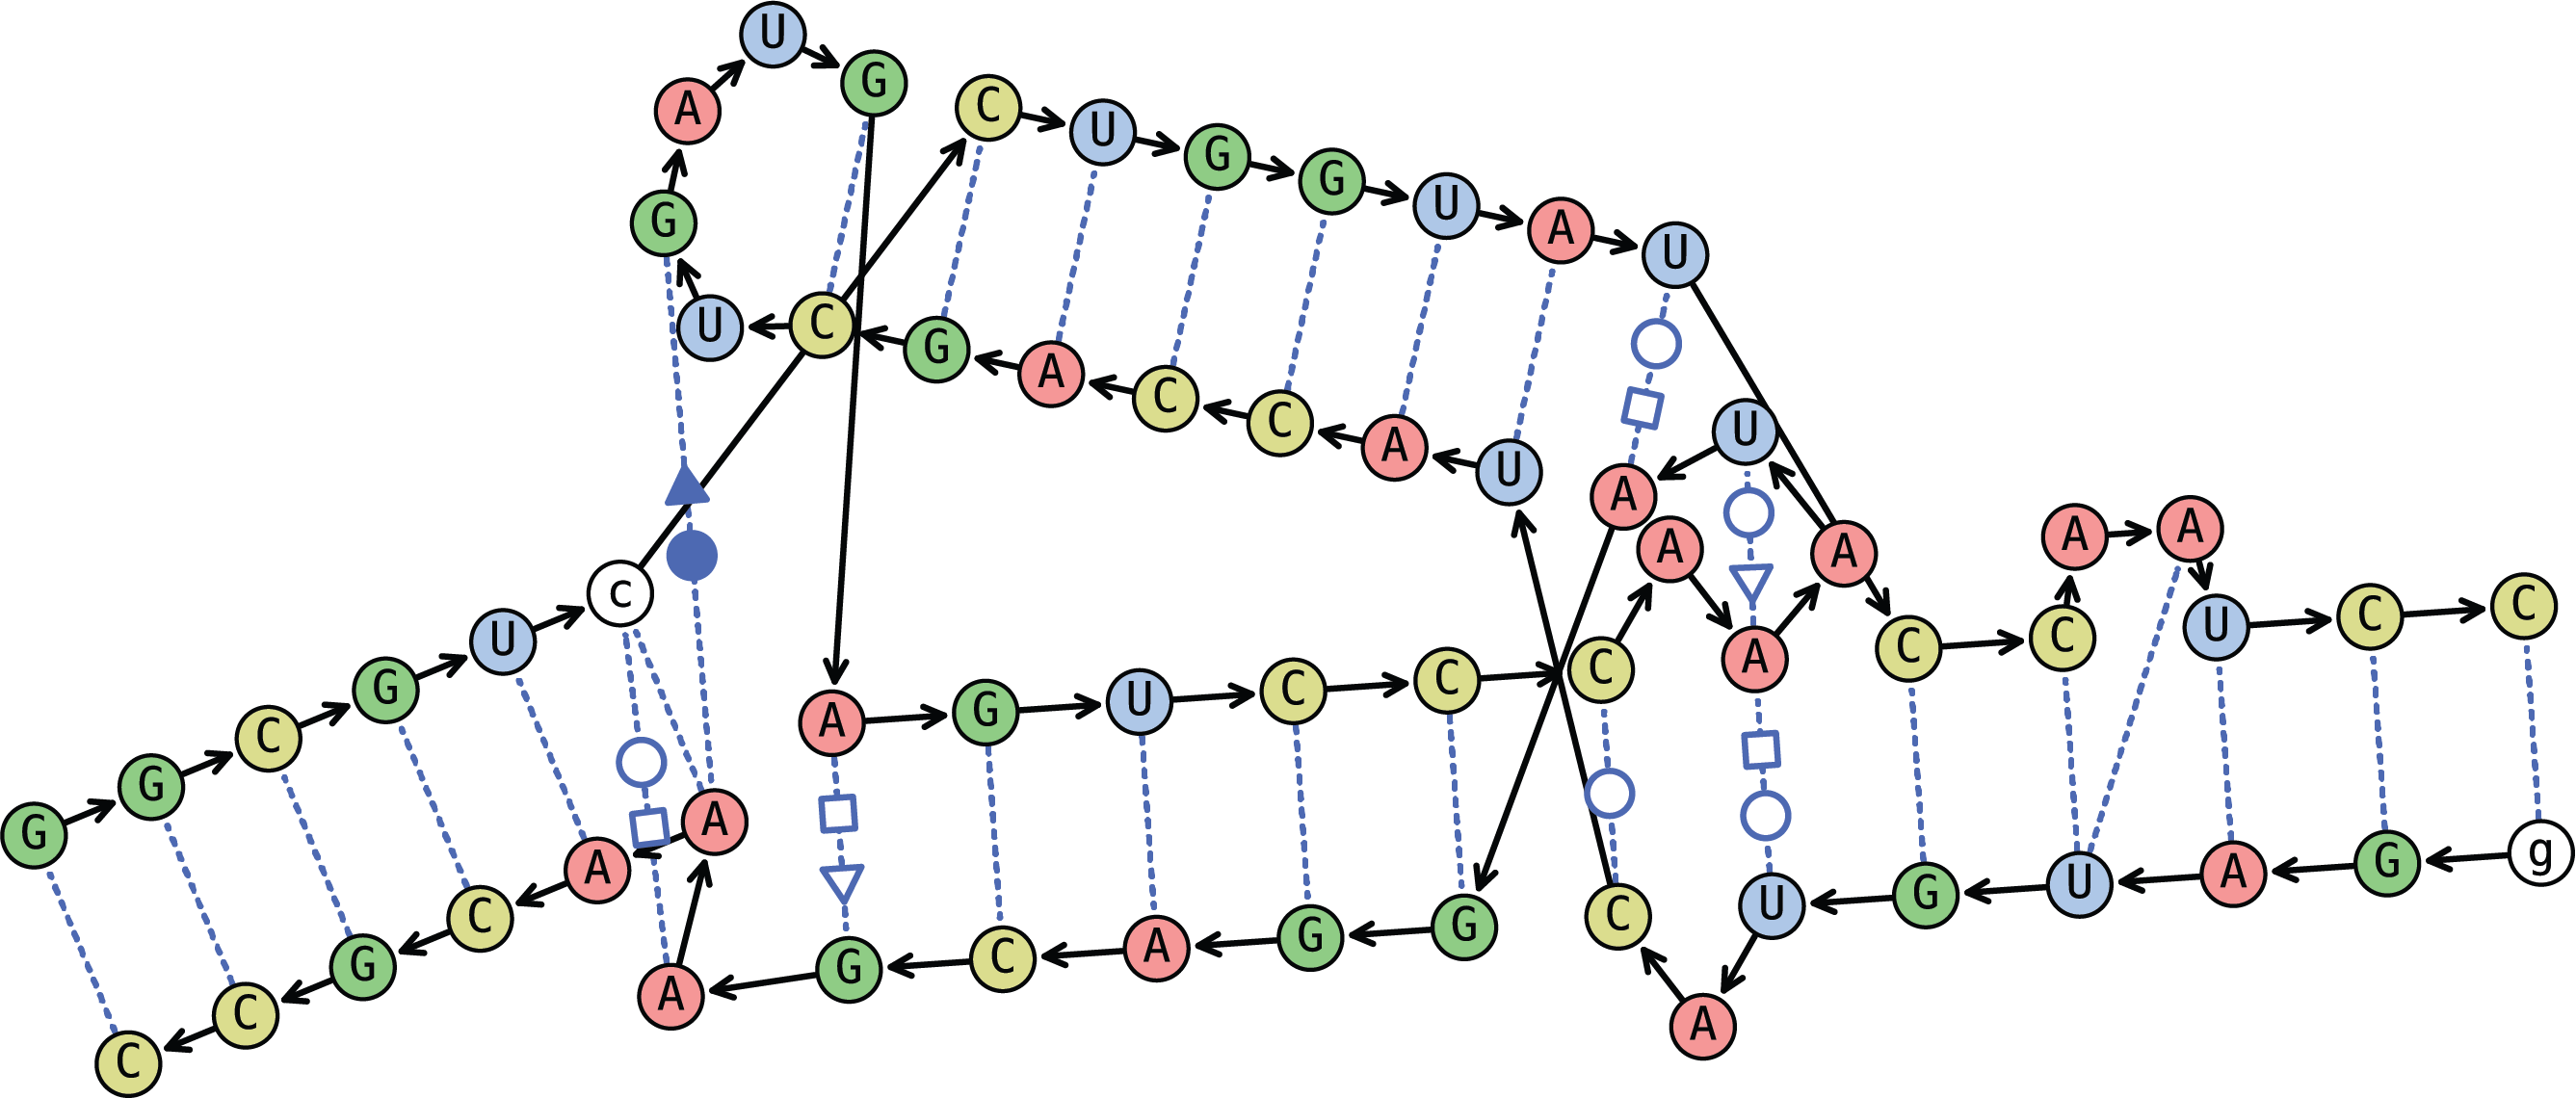
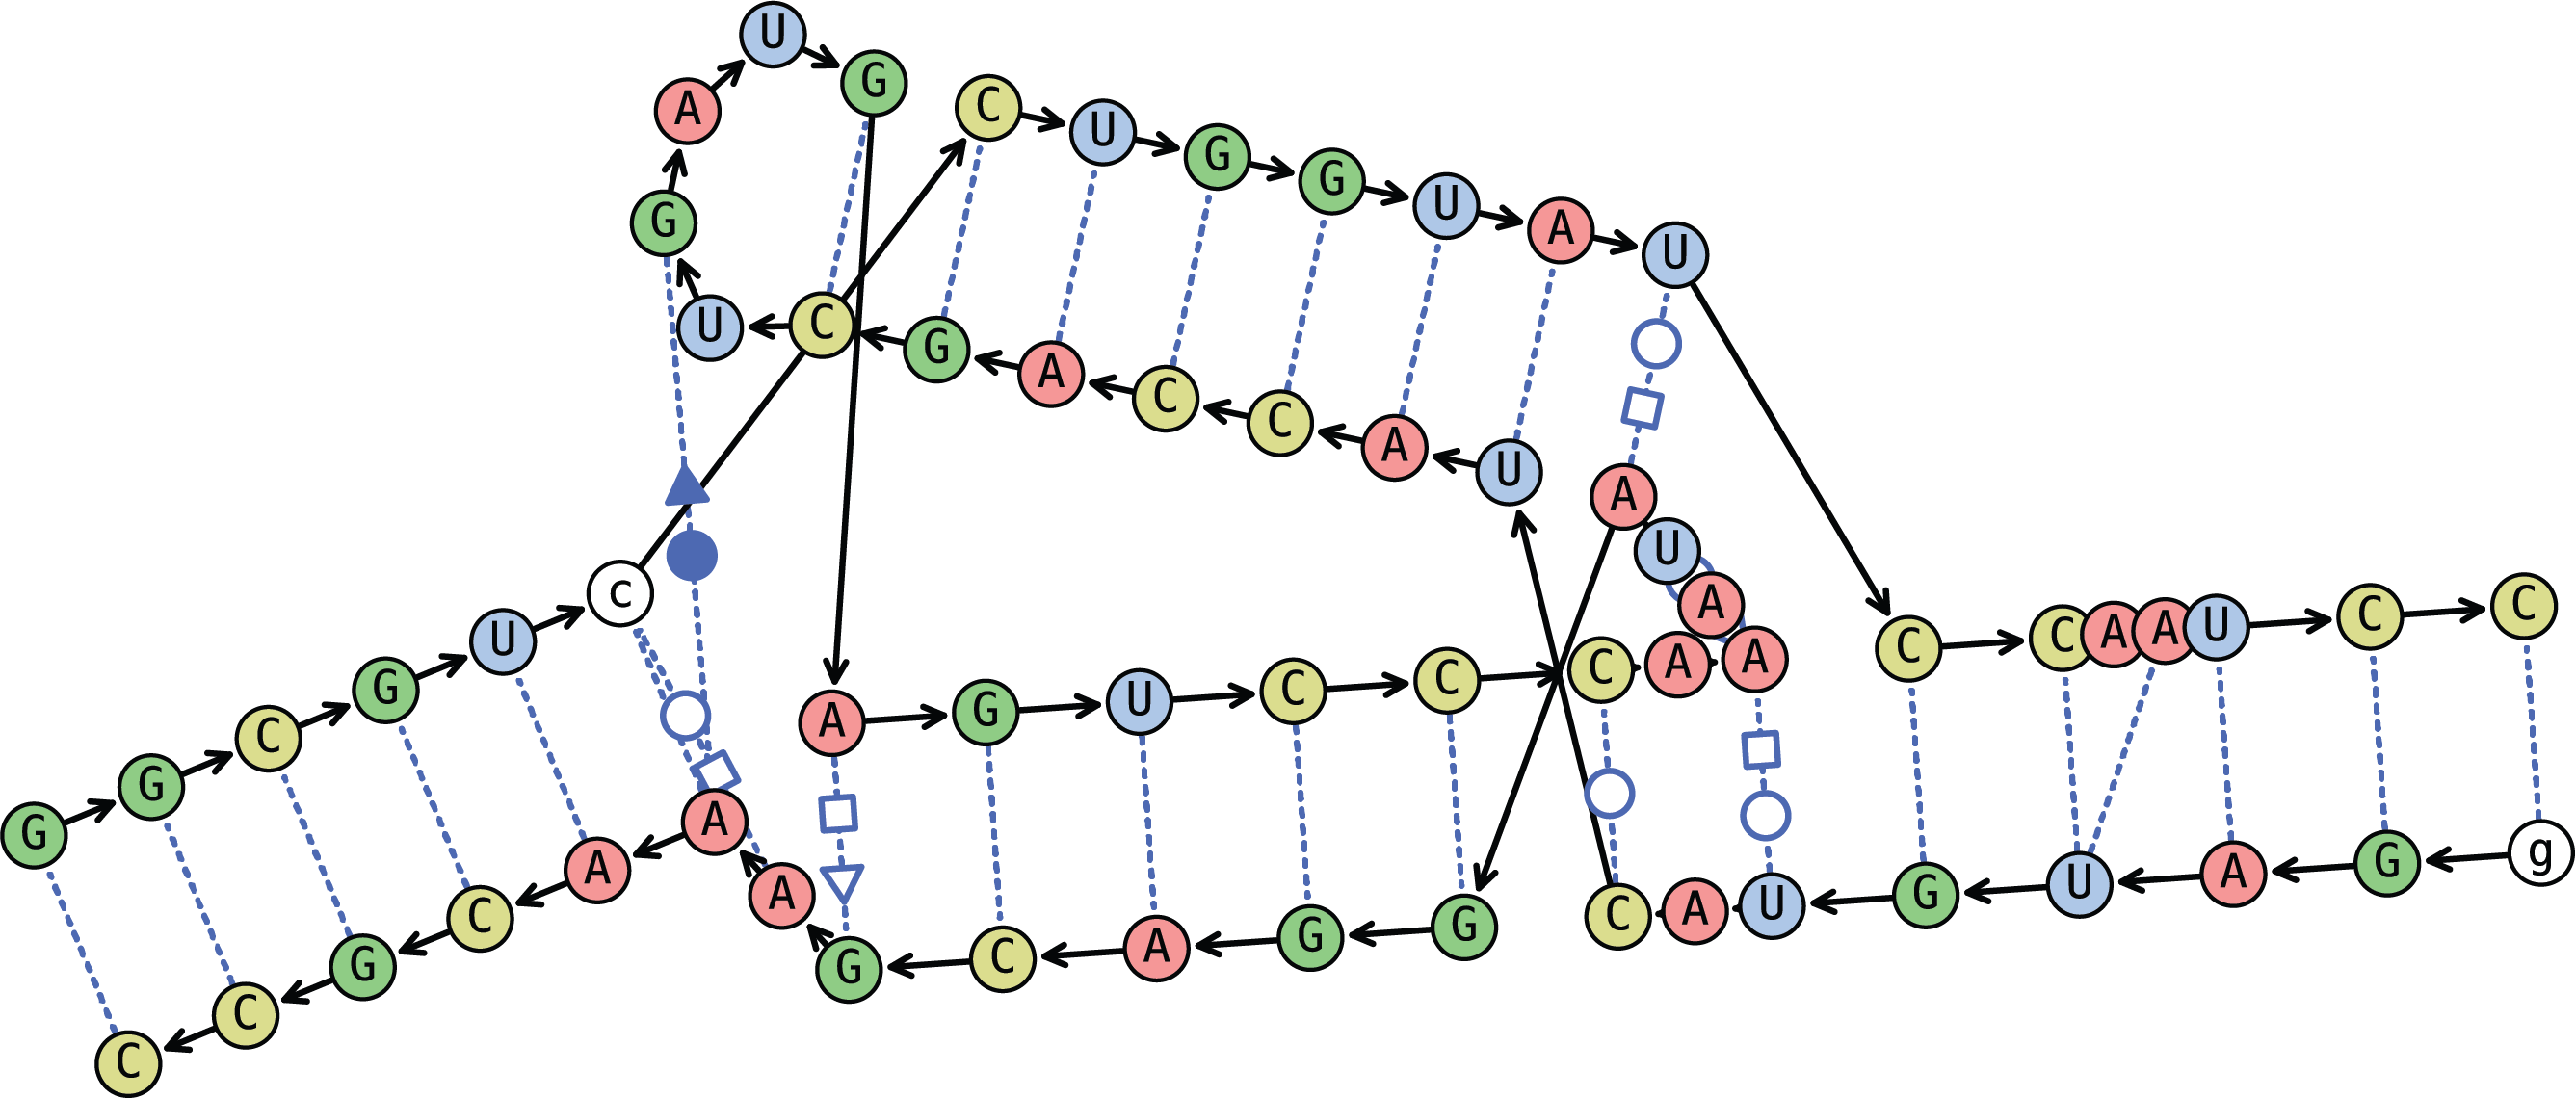
Visualizing Data
5' to 3' polarity is indicated by the default blue arrows (→) between nucleotides.

After a structure is visualized or regenerated, you can manipulate the visualization using:
The Rotate Image slider, which alters the rotation of the structure. Simply click Regenerate Plot afterwards to regenerate the graph and text labels in the new orientation.
The zoom tools, which allow a user to Zoom In, Zoom Out, Center the graph, and to Reset any previous zooming/panning.
You can also scroll over the image to Zoom In or Zoom Out.
To pan, click the image and drag with your mouse. This works especially well to visualize parts of larger structures.
Non-Watson-Crick (non-WC) nucleotides are by default white on the plot. Click Log to see more information about them including their DSSR IDs.
Saving Output
Click the Download button to download the RNAscape output image. You can download an SVG or PNG.
If the image is rotated, RNAscape will generate a rotated PNG or SVG. However, as a best practice, we recommend clicking Regenerate Plot to reprocess and optimize the image.
Advanced users can click Download and Coordinates in Numerical Format (NPZ) to download the RNAscape backend output as an NPZ file, which can be opened in Python. This includes the mapped 2D positions for each nucleotide.
Users can download the Log by clicking Download and Logfile.
Lastly, for applicable structures, users can interactively Modify Coordinates of the graph as described above.
Processing Settings
Processing settings affect the geometric mapping (nucleotide positioning). Therefore, please click Run (to run the full pipeline) in order to change them for an existing plot.

If Ladder Orientation Post-Processing is checked, projected helical ladders within 30° and 20 Å are merged.
By default, RNAscape bulges out loops to reduce crowding. Setting Bulge Out Loops to Conditional reduces the size of the graph, but may create more RNA overlap.
The left image depicts Always Bulging. Notice the additional space in its right helical ladder.
The right image depicts Conditional Bulging. We recommend experimenting to see what looks best for a given structure.
Visual Settings
There are four Visual Settings categories: Nucleotide Settings, Number Settings, Add Second Plot, and Color Settings.
After changing visual settings for an existing plot, simply click Regenerate Plot to view them. This avoids re-running the geometric mapping pipeline and is therefore faster.
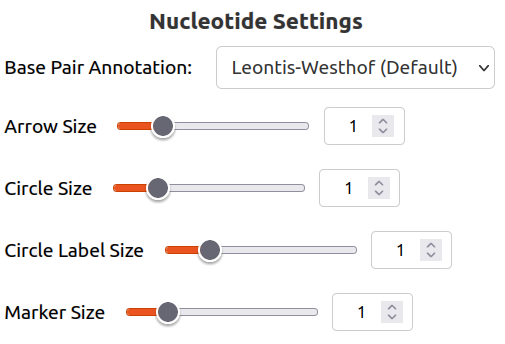
Base Pair Annotation changes how non-WC base pairing is notated. It is discussed in detail below. Please note that it can be turned off altogether by selecting None.
Arrow Size modifies how large the arrows are between nucleotides (on each chain). These arrows can be turned off altogether by setting it to 0, and the default is 1.
Circle Size modifies how large the circles are surrounding each nucleotide. They can be turned off altogether by setting it to 0 (seen below). The default is 1.

Circle Label Size modifies how large the text is for each nucleotide. The default is 1.
Marker Size modifies how large the base pair annotation markers are. The default is 1.
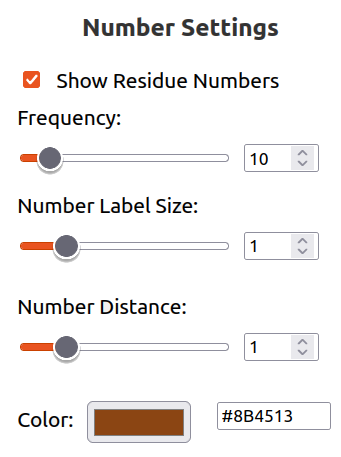
Check/uncheck Show Residue Numbers to turn on/off residue numbers. If checked, four additional options are shown:
Frequency modifies how often number labels are shown for each chain. The default is every 10.
Number Label Size modifies how large the number labels are. The default is 1.
Number Distance changes how far away the number labels are from their corresponding nucleotides. The default is 1.
Color changes the color of number labels.
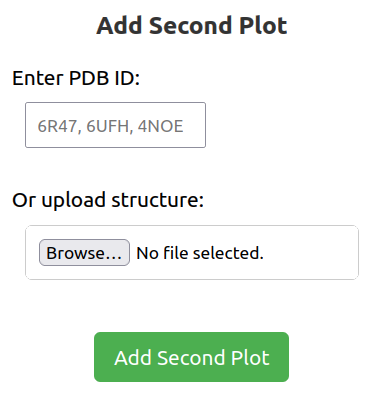
RNAscape natively supports the side-by-side comparison of two plots.
After the first structure is visualized, simply click Visual Settings and either select the PDB ID or upload the second structure.
Two sets of plot controls will be shown. The first structure is on the left (top controls), and the second structure is on the right (bottom controls).
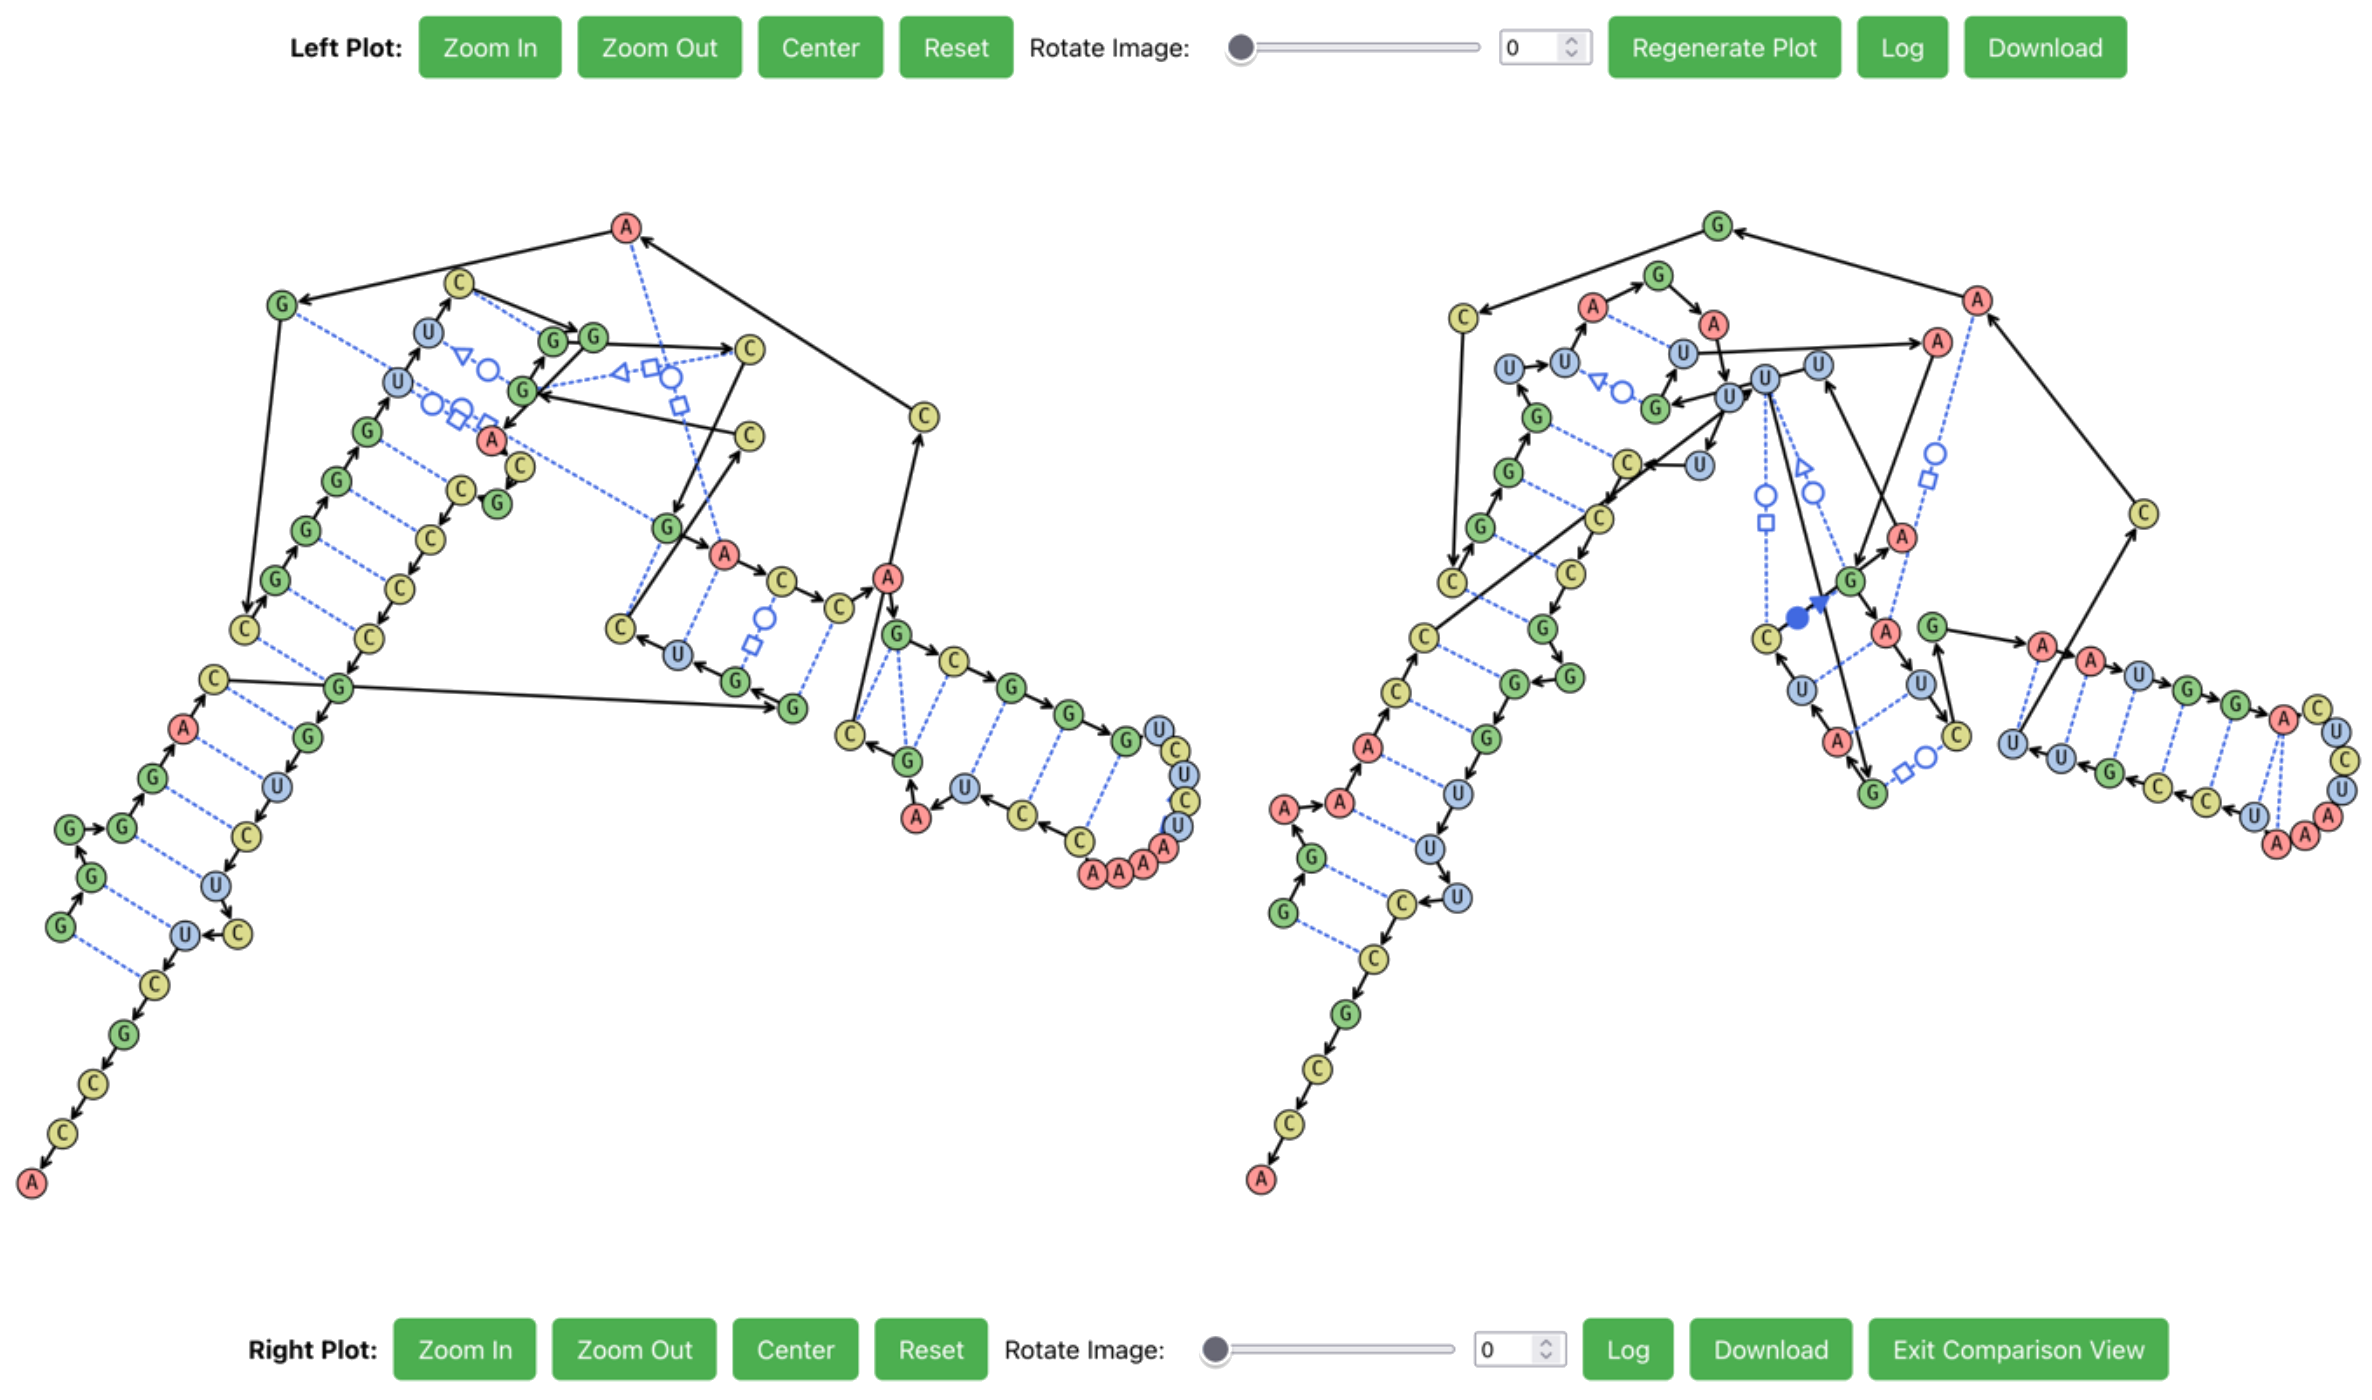
To exit this view, click Exit Comparison View in the bottom plot controls.
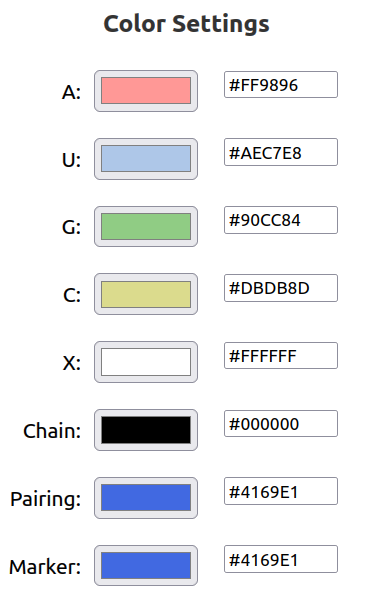
In Color Settings, you can customize the color of each nucleotide type and other features, either by clicking on the color box, or by inputting a custom hex value. 'X' refers to a non-standard nucleotide.
Depending on your operating system and web browser, the color selector box may appear differently than the ones depicted above.
Chain refers to the nucleic acid backbone, denoted in the 5' to 3' direction.
Pairing refers to base pairs, denoted by dotted lines.
Marker refers to base pair annotation symbols, denoted by circles, squares, and trianges on the pairing.
Base Pair Annotation
RNAscape supports three Base Pair Annotation styles, which can be changed in Advanced Settings: Leontis-Westhof, Saenger, and DSSR. You can also select None to remove them altogether.
The definitions surrounding base pairing can be ambiguous in some cases. All base pairing is calculated via X3DNA-DSSR, which can differ from other methods.
For the Saenger Base Pair Annotation, there are 28 possible base pair types. For this reason, no legend is provided.
The Leontis-Westhof Base Pair Annotation Legend has two main parameters:
c/t refer to a cis or trans bond orientation respectively.
W/H/S refer to a Watson-Crick, Hoogsteen, or Sugar edge respectively.
You can find more information regarding Saenger and Leontis-Westhof Base Pair annotations here.
The DSSR Base Pair Annotation Legend has two main parameters:
c/t refer to a cis or trans bond orientation respectively.
M/m/W refer to major groove, minor groove, or Watson-Crick edge respectively.